This Business Intelligence dashboard provides users with data about class sections for a chosen term. One can retrieve information about capacity, enrollment, seat count availability, meeting days and times, facility ID information-including building abbreviation and room numbers-and instructor information.
- You must have one of the roles listed below to access this report.
- If you have taken Curriculum Management Basics/Advanced, or Student Records 101, or Student Central Advisor Center and followed up on obtaining your security roles, you will already have one of the roles listed below.
- If you have not taken a training class, please request the FSU_SR_CLASS_SCHED_RPT_VIEW role.
| FSU_SR_CLASS_SCHED_RPT_VIEW |
| FSU_SR_CLASS_SCHED_SUPER |
| FSU_SR_CLASS_SCHED_VIEW |
| FSU_SR_DEPT_SCHEDULER |
| FSU_SR_MAINT_REG_SUPER |
| FSU_SR_MAINT_REG_VIEW |
IMPORTANT! myFSU BI is supported on the following browsers:
- Chrome: 12.x-29.x, but not on the latest version of Chrome-30.x
- Firefox: 17+, 10+, 6+, 3.5+
- Internet Explorer (IE): 7.x-10.x
Navigation
Go to my.fsu.edu>Faculty and Staff tab. Under myFSU Links, click the BI icon. On the BI main page, go to Dashboards>CSW-Course Management Scheduling>Class Scheduling and Enrollment.
![]()
Course Section Management Tab
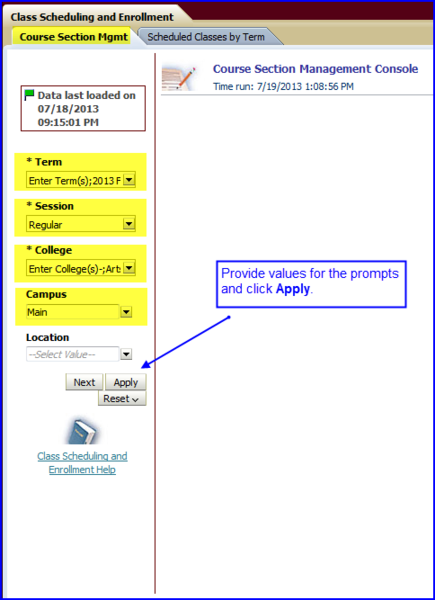
1. Upon navigating to the Class Scheduling and Enrollment dashboard, it appears with the Course Section Mgmt tab active. Enter values for the necessary prompts and click Apply. (In this example, values were supplied for all of the prompts except Location.) The report appears.
NOTE: Clicking the Next button allows you to enter values for Academic Org (i.e. Chemistry or English), Subject Code, and Class Status.
2. The user can set the data-view using options available in drop-down boxes. The first drop-down box provides three choices:
- **Total Sections & Enroll Cap
- Summary View
- Detailed View
**If Total Sections & Enroll Cap is selected, another drop-down box is available with selections that further refine the data-view:
- Section Count
- Enrollment Capacity
- Total Enrollment
- Total Seats Available


3. Select the data-view appropriate to your purpose. The images below illustrate data-views when Total Sections & Enroll Cap is chosen in conjunction with one of four distinct column views.
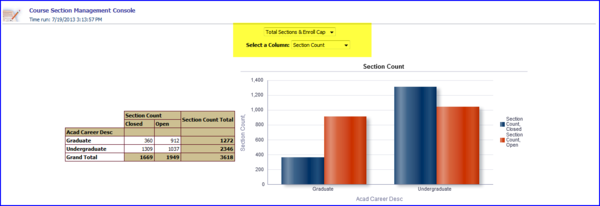
Total Sections & Enroll Cap with the Section Count column view chosen
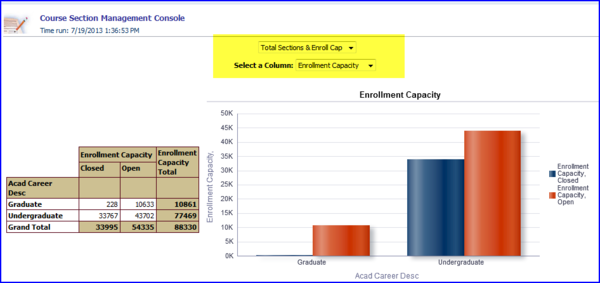
Total Sections & Enroll Cap with the Enrollment Capacity column view chosen
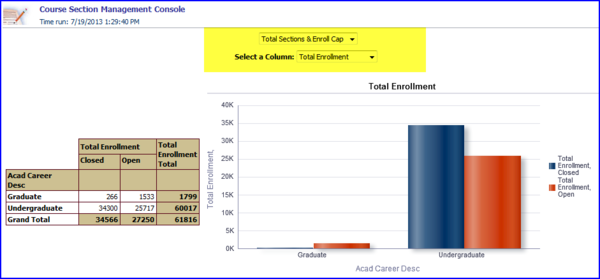
Total Sections & Enroll Cap with the Total Enrollment column view chosen
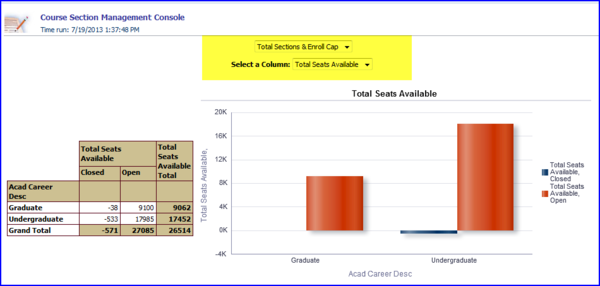
Total Sections & Enroll Cap with the Total Seats Available column view chosen
4. If you require a summary view, click Summary View in the drop-down box. The Summary View report generates.

5. In this example, the report reflects a summary of enrollment data by the college's departments-how many sections there are, how many sections are open versus closed, what the total enrollment capacities are and how many seats are actually open, and how many seats remain available.
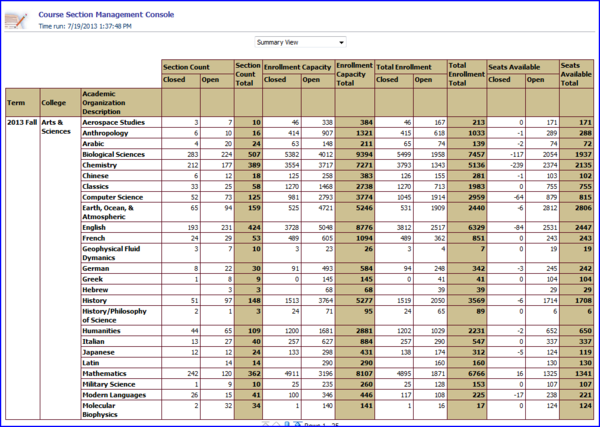
6. If you require a detailed view, click Detailed View in the drop-down box. The Detailed View report generates. Detailed View provides a granular look at class scheduling and enrollment data, including all of the data available in Summary View plus:
- academic career level
- academic organization code (department)
- academic organization description (department name)
- course code (legacy catalog number)
- class number (legacy reference number)
- course description (legacy short title)
- subject code (legacy course prefix)
- catalog number (legacy course number)
- class section code (legacy section number)
- class status (whether class section is active or not active)
Scheduled Classes by Term Tab
1. To generate a report detailing classes scheduled by term, click the Scheduled Classes by Term tab.

2. Enter values for the necessary prompts and click Apply. (In this example, values were supplied for all of the prompts except Location.) The report appears.
3. Two data views are available: The Class Sections - Meeting Times and the Class Sections - Instructors and Meeting Times views. Choose a view.

NOTE: Instructors and Meeting Times view includes all of the data available in Meeting Times view, plus instructor information.
4. The report is generated bases on the view you choose. The image below illustrates a report generated using Class Sections - Meeting Times view.
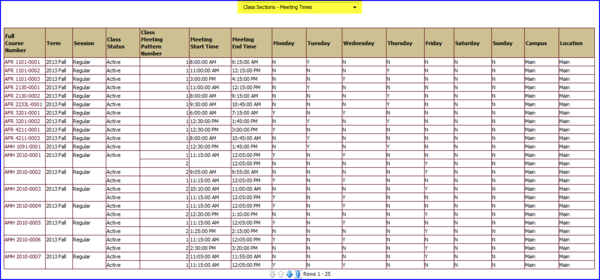
5. From the Scheduled Classes By Term tab, conditional reports can become available as links above a generated report. Conditional report links appear if classes in the original report have other descriptive data elements not presented in the original report. Links that may appear include:
- Distance Learning Classes only with no meeting time
- Classes only with no Instructor
- Classes with Meetings and no Rooms
- Classes with no Meetings
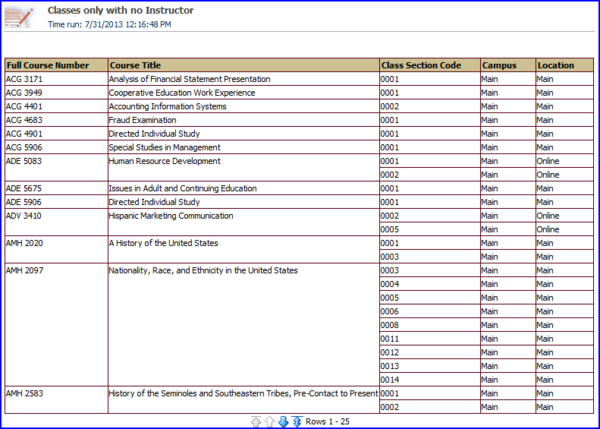
The image below represents an example of the Classes only with no Instructor conditional report:
6. When you generate a Scheduled Classes by Term report, in the Full Course Number column you can click any Full Course Number link and a Class Enrollment button appears.

7. Click the Class Enrollment button. A detailed view appears, including a Student Enrollment Count column.
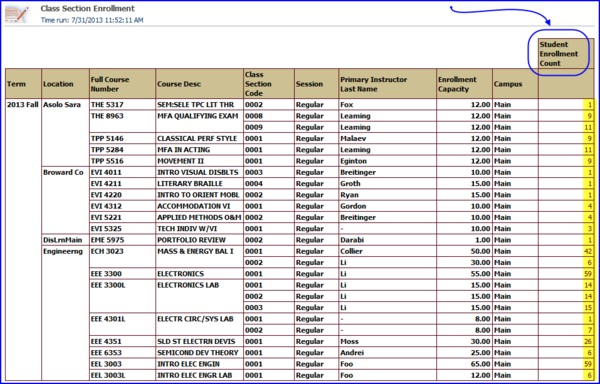
8. Choose the class section for which you want to see enrollment. Click the Student Enrollment Count button for that class section.
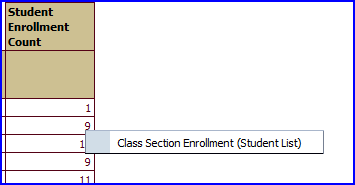
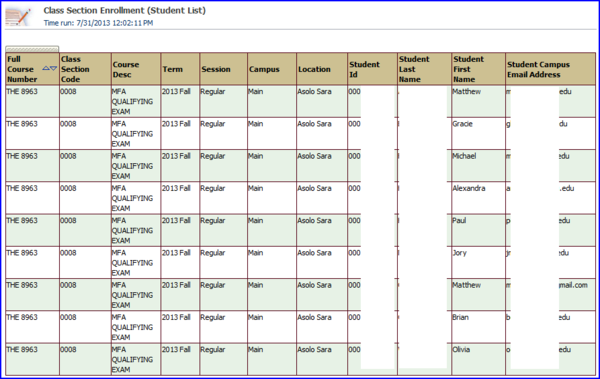
9. The detail view of the Class Section Enrollment (Student List) appears.
