This Business Intelligence dashboard provides the same reporting capability previously available in the Course Schedule Master. If you need to know how many seats in a class section remain open, or who is teaching a particular section of a class, this report is the one to run.
- You must have one of the roles listed below to access this report.
- If you have taken Curriculum Management Basics/Advanced, or Student Records 101, or Student Central Advisor Center and followed up on obtaining your security roles, you will already have one of the roles listed below.
- If you haven't taken one of these courses and you need to access this dashboard, request FSU_SR_ENROLL_RPT_VIEW.
| FSU_SR_CLASS_SCHED_SUPER |
| FSU_SR_CLASS_SCHED_VIEW |
| FSU_SR_DEPT_SCHEDULER |
| FSU_SR_MAINT_REG_SUPER |
| FSU_SR_MAINT_REG_VIEW |
IMPORTANT! myFSU BI is supported on the following browsers:
- Chrome: 12.x-29.x, but not on the latest version of Chrome-30.x
- Firefox: 17+, 10+, 6+, 3.5+
- Internet Explorer (IE): 7.x-10.x
Navigation
Go to my.fsu.edu>Faculty and Staff tab. Under myFSU Links, click the BI icon. On the BI main page, go to Dashboards>CS-Real Time-Enrollment>Class Search and Utilization.
![]()
Obtaining Reports Using Search Tab Functionality
Providing values for search prompts on the Search tab returns reports that include instructor information, how many seats are available and how many remain open, where and when a class is being taught, and the class's status (that is, is it open, cancelled, etc.).
1. Upon navigating to the Class Search and Utilization dashboard, it appears with the Search tab active.
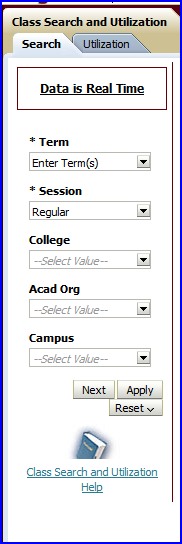
NOTE: The Utilization and Search tabs provide identical prompts: Term, Session, College, Acad Org, and Campus. From either tab, click Next to access Location, Physical Location, Subject, and Class Status prompts.
2. Select values from the dashboard's drop-down prompts as appropriate. In this example, the following values were chosen:
- Term = 2013 Fall
- Session = Regular
- College = Business
- Acad Org = Marketing
- Campus = MAIN
3. If necessary, click Next to choose additional prompt values by which to constrain the report.
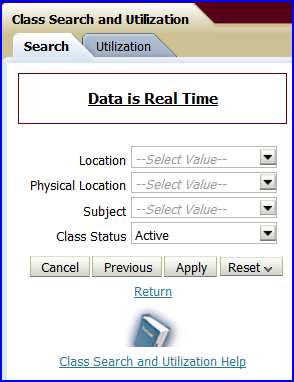
CAUTION: You must provide values in the Term and Session drop-down prompts. Providing values for the other prompts is optional.
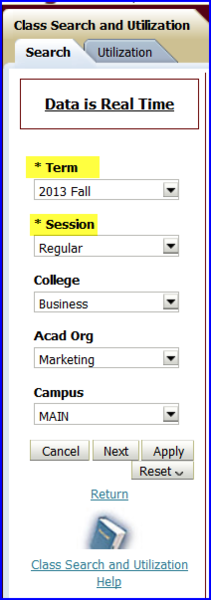
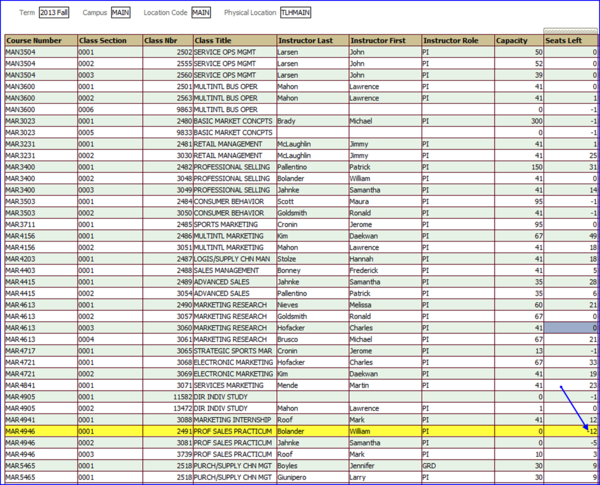
4. After selecting values for the required prompts, click Apply. A result-set based on your selections is returned. In this example, all class sections offered by Marketing (the academic organization) on main campus for the 2013 Fall term are displayed.
NOTE: Due to space constraints, all search-result columns and rows are not pictured in the image below. (Columns not shown are: Facility ID, Meeting Days and Times, College, Acad Org, and Class Status.)
IMPORTANT:
- In the Seats Left column, negative values represent the number of seats by which a class has been over-enrolled. (See MAR 4946 Section 0001 above)
- A class section's meeting days appear in one column regardless of how many days a week the class meets.
Day abbreviations are: M/T/W/R/F/S/Z where R = Thursday and Z = Sunday. - When a class section has more than one meeting time, multiple rows appear to capture the meeting-time data.
Obtaining Reports Using Utilization Tab Functionality
Providing values for prompts on the Utilization tab returns reports that include information about capacity, enrollment, and utilization. Four "lenses" are available through which to view data. In order from most-to-least granular they are: the Class section view, the Course view, the Academic Org (department) view, and the College view.
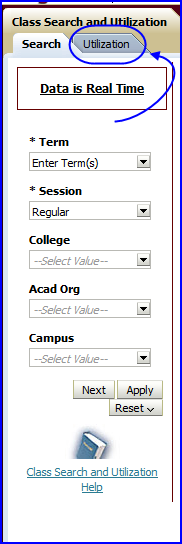
1. Click the dashboard's Utilization tab.
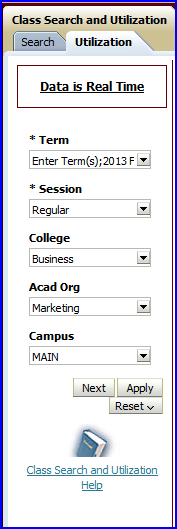
2. In this example, the same prompt values are used on the Utilization tab as were used previously:
- Term = 2013 Fall
- Session = Regular
- College = Business
- Acad Org = Marketing
- Campus = MAIN
3. Click Apply. The following is an example of the report that currently appears based on the prompt values defined above:
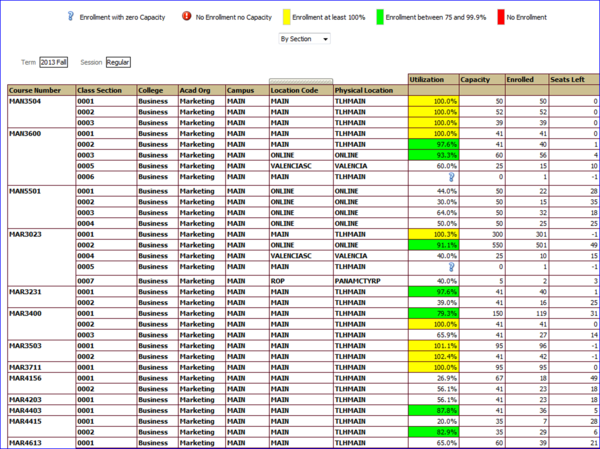
4. If required, select a view other than By Section from the type of views drop-down box. Possible views are By Section, By Course, By Acad Org, and By College:

CAUTION: When working on the Utilization tab, do not select an Acad Org prompt value on the dashboard if the By College view is chosen. If these two values are used in combination, results generated are only for the academic organization, not for the entire college.
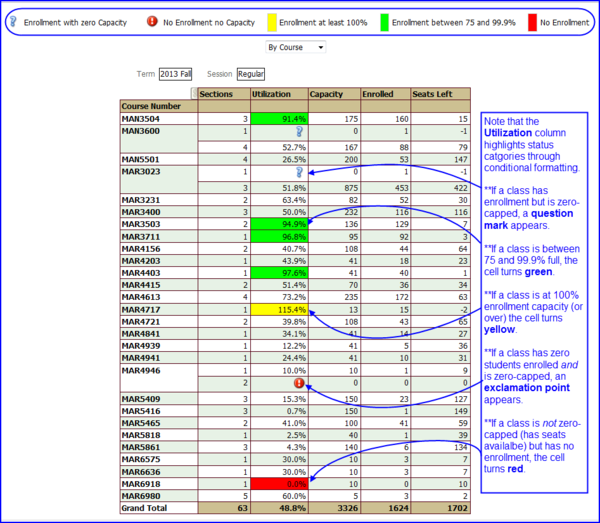
5. In the following example, the results displayed result from having chosen By Course from the drop-down prompt. (Note that results compile numbers based on all sections of any given course.)
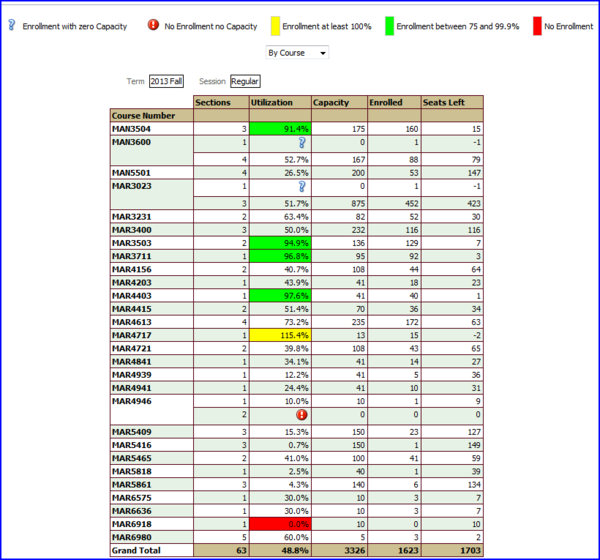
NOTE: In any of the four views (By Section, By Course, By Acad Org, or By College) conditional formatting in the Utilization column appears when certain criteria are met.
The Utilization column highlights status through conditional formatting.
- If a class has enrollment but is zero-capped, a question mark appears.
- If a class is between 75% and 99.9% full, the cell turns green.
- If a class is at 100% enrollment capacity (or over) the cell turns yellow.
- If a class has zero students enrolled, and is zero-capped, an exclamation point appears.
- If a class is not zero-capped (has seats available) but has no enrollment, the cell turns red.
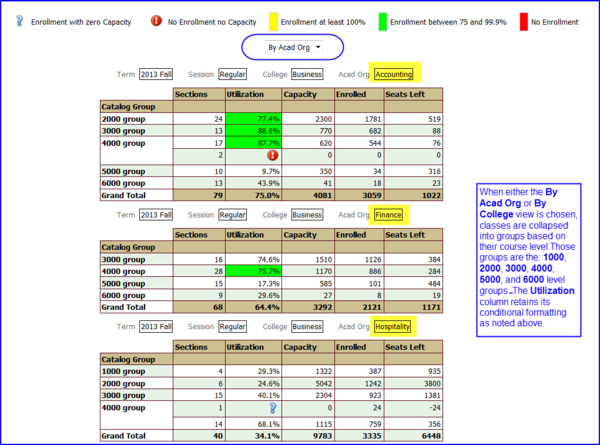
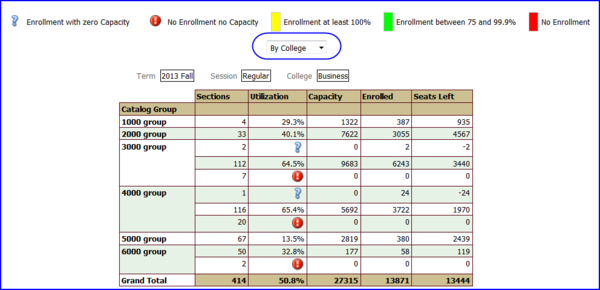
NOTE: In By Acad Org and By College views (the images above and below, respectively), courses are collapsed into groups by level. That is:
- the 1000 group comprises all values 1000-1999;
- the 2000 group comprises all values 2000-2999, and so on.
NOTE: Click the Class Search and Utilization Help link to access additional information about this particular dashboard.

