This Business Intelligence dashboard allows you to track and report the distribution of awarded grades. You can view this information sorted by Campus, Location, College Offering the Class, Academic Organization Offering the Class, Course, Class Section, and Primary Instructor. This reporting aids in evaluating students, courses, class sections, and instructors.
- To gain access to this report, you must have just one of the roles listed below.
- If you have taken Student Records 101 or Student Central Advisor Center training and followed up on obtaining your security roles, you will already have one of the roles listed below.
- If you haven't taken one of those courses and you need to access this report, request FSU_SR_ENROLL_RPT_VIEW.
| FSU_SR_ENROLL_RPT_VIEW |
| FSU_SR_ENROLL_SUMMARIES_USER |
| FSU_SR_STU_PROG_PLAN_VIEW |
| FSU_SR_TERM_HISTORY_VIEW |
IMPORTANT! myFSU BI is supported on the following browsers:
- Chrome: 12.x-29.x, but not on the latest version of Chrome-30.x
- Firefox: 17+, 10+, 6+, 3.5+
- Internet Explorer (IE): 7.x-10.x
Navigation
Go to my.fsu.edu>Faculty and Staff tab. Under myFSU Links, click the BI icon. On the BI main page, go to Dashboards>CSW-Enrollment>Grade Distribution.
![]()

Steps-Grade Distribution - Org Offering Class
1. After navigating to the dashboard ensure the Grade Distribution - Org Offering Class tab is selected, and provide values for the prompts. Click Apply. In the example below, the following values are selected:
- Term = Fall 2013
- Class Level = Undergraduate
- Campus of Class = Main
- Location of Class = Main
- College offering Class = Business
- Acad Org of Class = Finance
- Full Course = (blank)
- Primary Instructor EMPLID = (blank)
- Grades to Include = B+
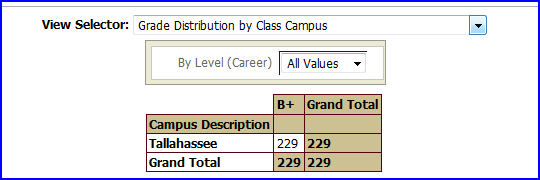
2. The dashboard returns the report, whose data you can choose to view by the selection made in the View Selector drop-down box. The example below displays the Grade Distribution by Class Campus view.

Other available views are noted in the image below:

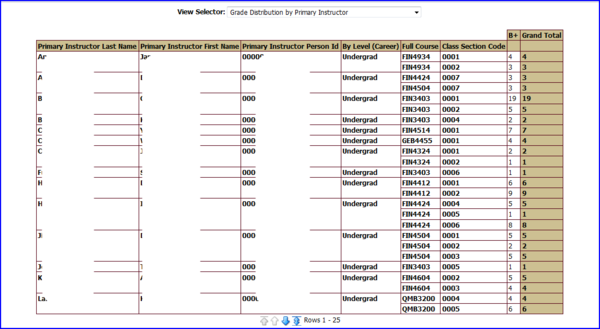
An example of the Grade Distribution by Primary Instructor view is provided below:

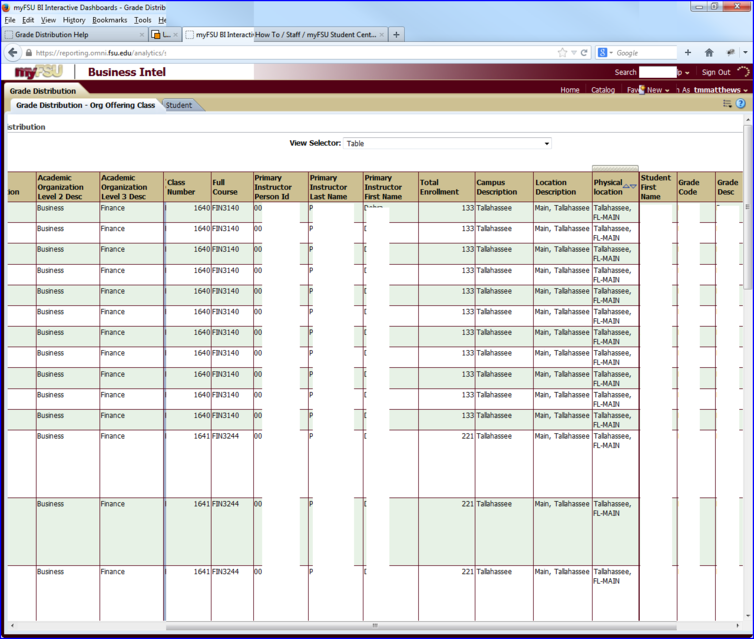
Selecting the Table view results in a report containing values for all parameter values. In this example, no one value was chosen for full course or primary instructor; thus, all possible values are returned for those parameters as they are constrained by the values that were chosen for the other parameters. (For example, note that both FIN 3140 and FIN 3244 are displayed.)

Steps-Grade Distribution - Select Org of Student
1. After navigating to the dashboard ensure the Grade Distribution - Select Org of Student tab is selected, and provide values for the prompts. Click Apply. In the example below, the following values are selected:
- Term = Fall 2013
- Academic Career of Students = Undergraduate
- College of Student = Business
- Academic Org of Students = Finance
- Academic Plan of Students = (blank)
- Academic Level of Students = (blank)
- Student Id = (blank)
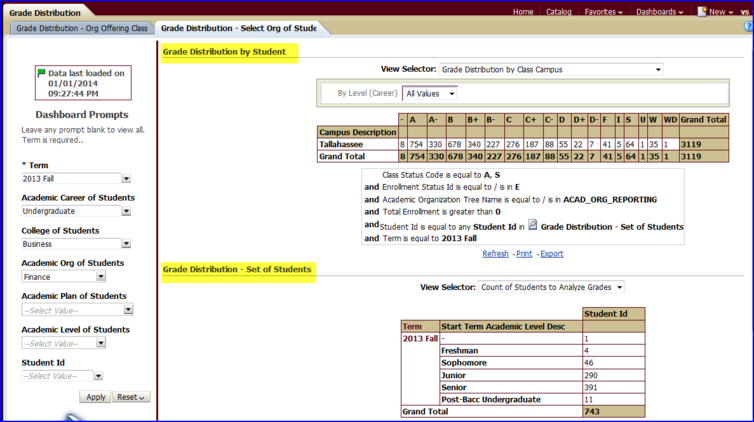
2. The dashboard returns the report, whose data is displayed in a split view: Grade Distribution by Student and Grade Distribution-Set of Students.
NOTE: The Grade Distribution by Student view is displaying the results for main campus students whose Academic Organization is Finance. EXAMPLE: If a finance student took four classes in Fall 2013 and received an A in all of those courses, then regardless of what department (academic organization) offered the courses, the tally of the A column includes all four As.

