This Business Intelligence dashboard returns reports that provide data about students based on academic plan, major, department, and/or college. Additionally, you can configure the report to return data that reflects university-level totals.
- To gain access to this report, you must have just one of the following roles
- If you have taken Student Records 101 or Student Central Advisor Center training and followed up on obtaining your security roles, you will already have one of the roles listed below.
- If you haven't taken one of those courses and you need to access this report, request FSU_SR_ENROLL_RPT_VIEW.
| FSU_SR_ENROLL_RPT_VIEW |
| FSU_SR_ENROLL_SUMMARIES_USER |
| FSU_SR_STU_PROG_PLAN_VIEW |
| FSU_SR_TERM_HISTORY_VIEW |
IMPORTANT! myFSU BI is supported on the following browsers:
- Chrome: 12.x-29.x, but not on the latest version of Chrome-30.x
- Firefox: 17+, 10+, 6+, 3.5+
- Internet Explorer (IE): 7.x-10.x
Navigation
Go to my.fsu.edu>Faculty and Staff tab. Under myFSU Links, click the BI icon. On the BI main page, go to Dashboards>CSW-Program Plan>Student Academic Plan Summary.
Selecting Search Criteria on the Dashboard
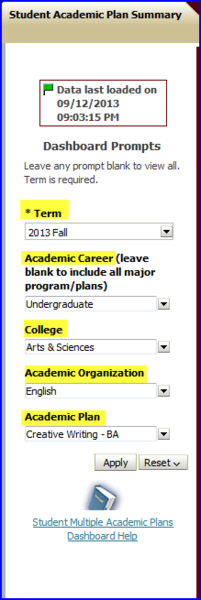
1. After navigating to the dashboard, provide values for the prompts and click Apply. In the example below, the following values are selected:
- Term = Fall 2013
- Academic Career = Undergraduate
IMPORTANT! Selecting a value for the Academic Career prompt excludes all non-primary majors because those majors do not have an associated career. If you do not want the report to exclude non-primary majors, leave this prompt blank. - College = Arts & Sciences
- Academic Organization = English
- Academic Plan = Creative Writing - BA
The report appears. The default view is the Summary Headcount view.
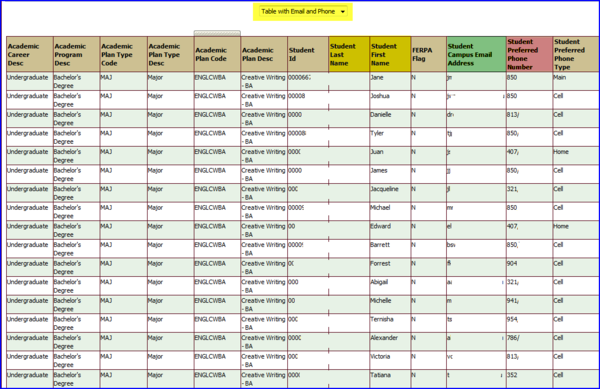
2. In this example, the report reflects a total enrollment of 365 students in the Creative Writing academic plan for Fall 2013. Click the drop-down box arrow and select Table with Email and Phone. A new report appears.

3. The Table with Email and Phone view supplies, among other data, the students' first and last names, campus email addresses, and phone numbers. Click the drop-down box arrow and select Table with Address. A new report appears.
NOTE: The image in this example has masked data to ensure student privacy.
4. The Table with Address view supplies all of the data the Table with Email and Phone view supplies, plus the students' addresses. Some students have more than one address. Consult the Student Address type column to determine which address you need.
NOTE: The image in this example has masked data to ensure student privacy.

5. From any Table view, the Student Actively Enrolled in in a Given Semester - driving query link is available. Clicking this link opens a table that displays the entire pool of actively enrolled students from which your report was culled.
CAUTION: Clicking this link is not recommended because this table is constrained by only the Term filter. (This means that the data set returned is enormous and takes a long time to load. For example, clicking the link in this report returned over 41,500 rows, and it took a minute or two to do so.) If you need a report that returns students' primary program/plan information, use the Dashboards>CSW - Enrollment>Student Demographics dashboard. This dashboard allows you to choose more filter values, reducing load time.

NOTE: Click the Class Search and Utilization Help link to access additional information about this particular dashboard.

To Export to Excel
1. To export the table to Excel, click the Export link at the bottom of the page. An Export menu appears.

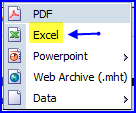
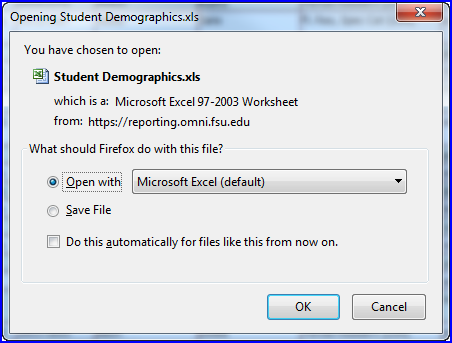
2. Click the Excel option. A dialog box appears asking if you want to open the file or save the file.
3. Choose Open with Microsoft Excel if you want to immediately view the file. Choose Save File if you would like to rename the file with an appropriately descriptive name before viewing it.
4. You may get this warning:

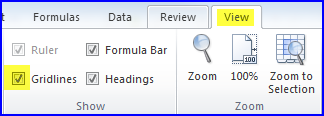
5. If so, click Yes. The Excel file opens. If the grid lines are not visible and you would like to turn them on, click the View tab and select the Gridlines check box.
NOTE: For more information on setting up your spreadsheet, see the FAQ section (scroll about halfway down the page) of the How To Run Queries and Create Excel Reports topic. Information on browsers can be found at Browser Settings-Tips & Tricks.
